Wattklok
Is solar or a home battery worth it for you?
Free, private calculator that shows whether solar panels, a home battery, or both pay off for your home
Simulates every hour of up to five years of your own history in a Web Worker – nothing is stored on a server
Imports Tibber via OAuth2 PKCE, or grid-operator CSV/Excel files from Sweden, Norway, Finland and Denmark
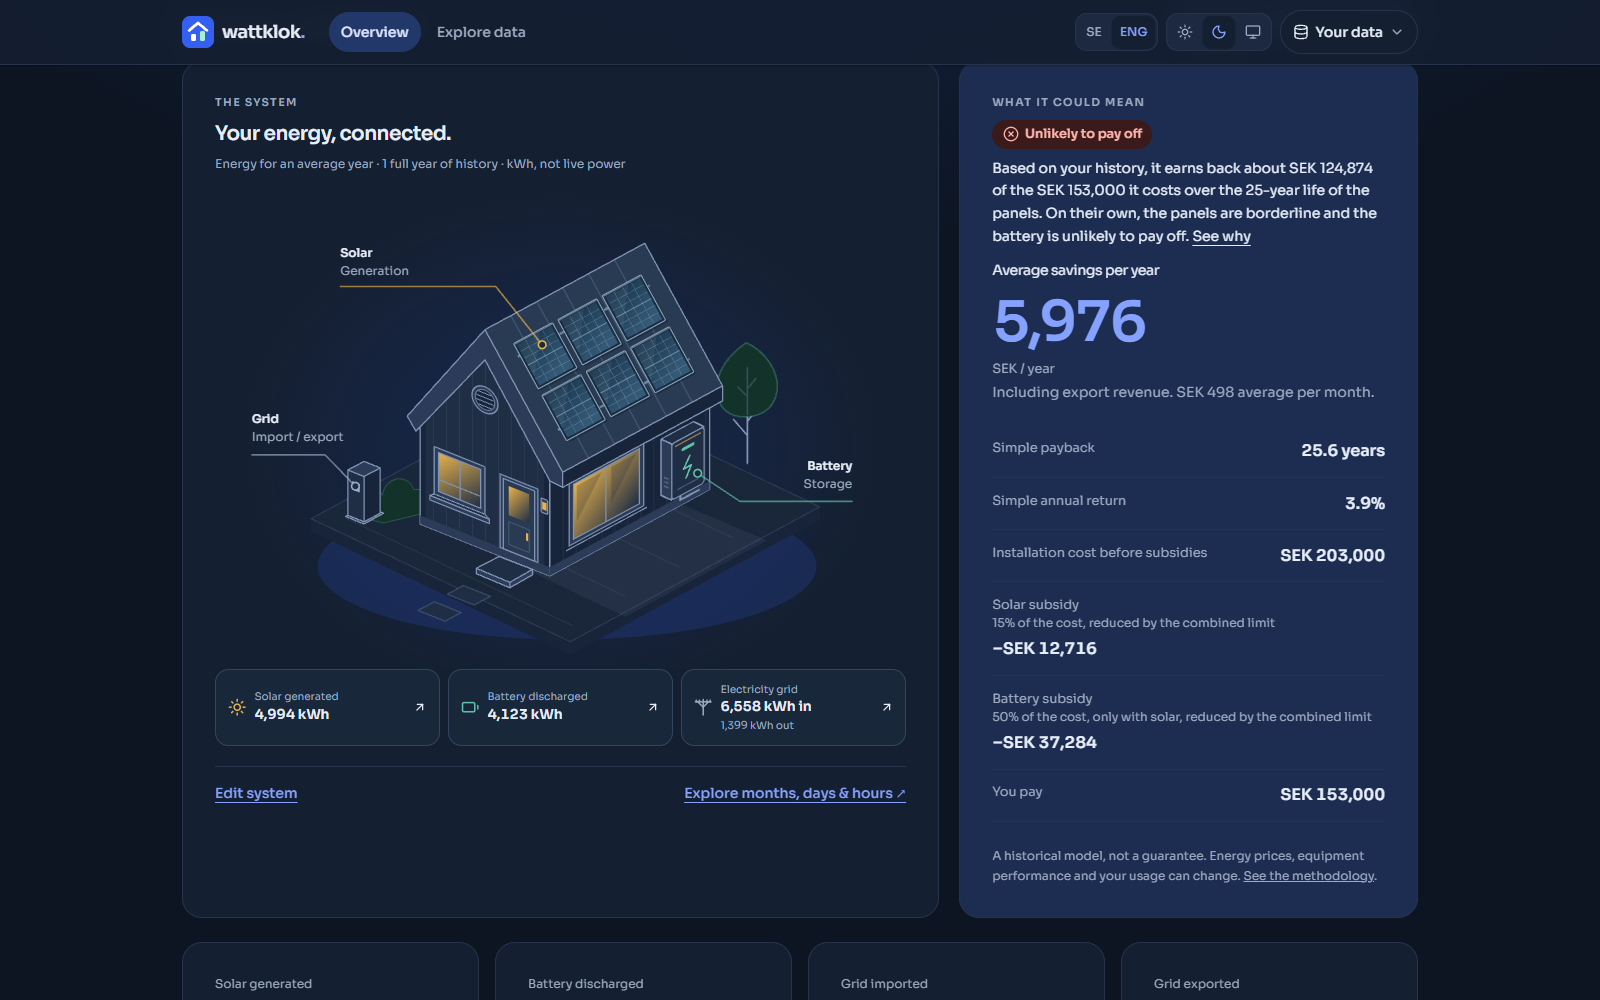
Compares battery strategies and system sizes against real spot prices, grid fees, VAT and subsidies
The problem
The solar and battery calculators I tried wanted my contact details, and then answered with averages. I wanted an answer based on my own electricity use.
Averages are exactly where these decisions go wrong. Whether a battery pays off depends on when you use electricity, how prices move within each day and how much sun you get in the hours that matter. A typical year smooths all of that away.
How it works
Connect a Tibber account or import the export file from your grid operator, and Wattklok combines your measured consumption with historical sunlight and day-ahead spot prices for your price area. Then it simulates every hour of up to five years of history: what the panels would have produced, what the battery would have charged and discharged, and what you would have paid – including grid fees, energy tax, VAT and subsidies.
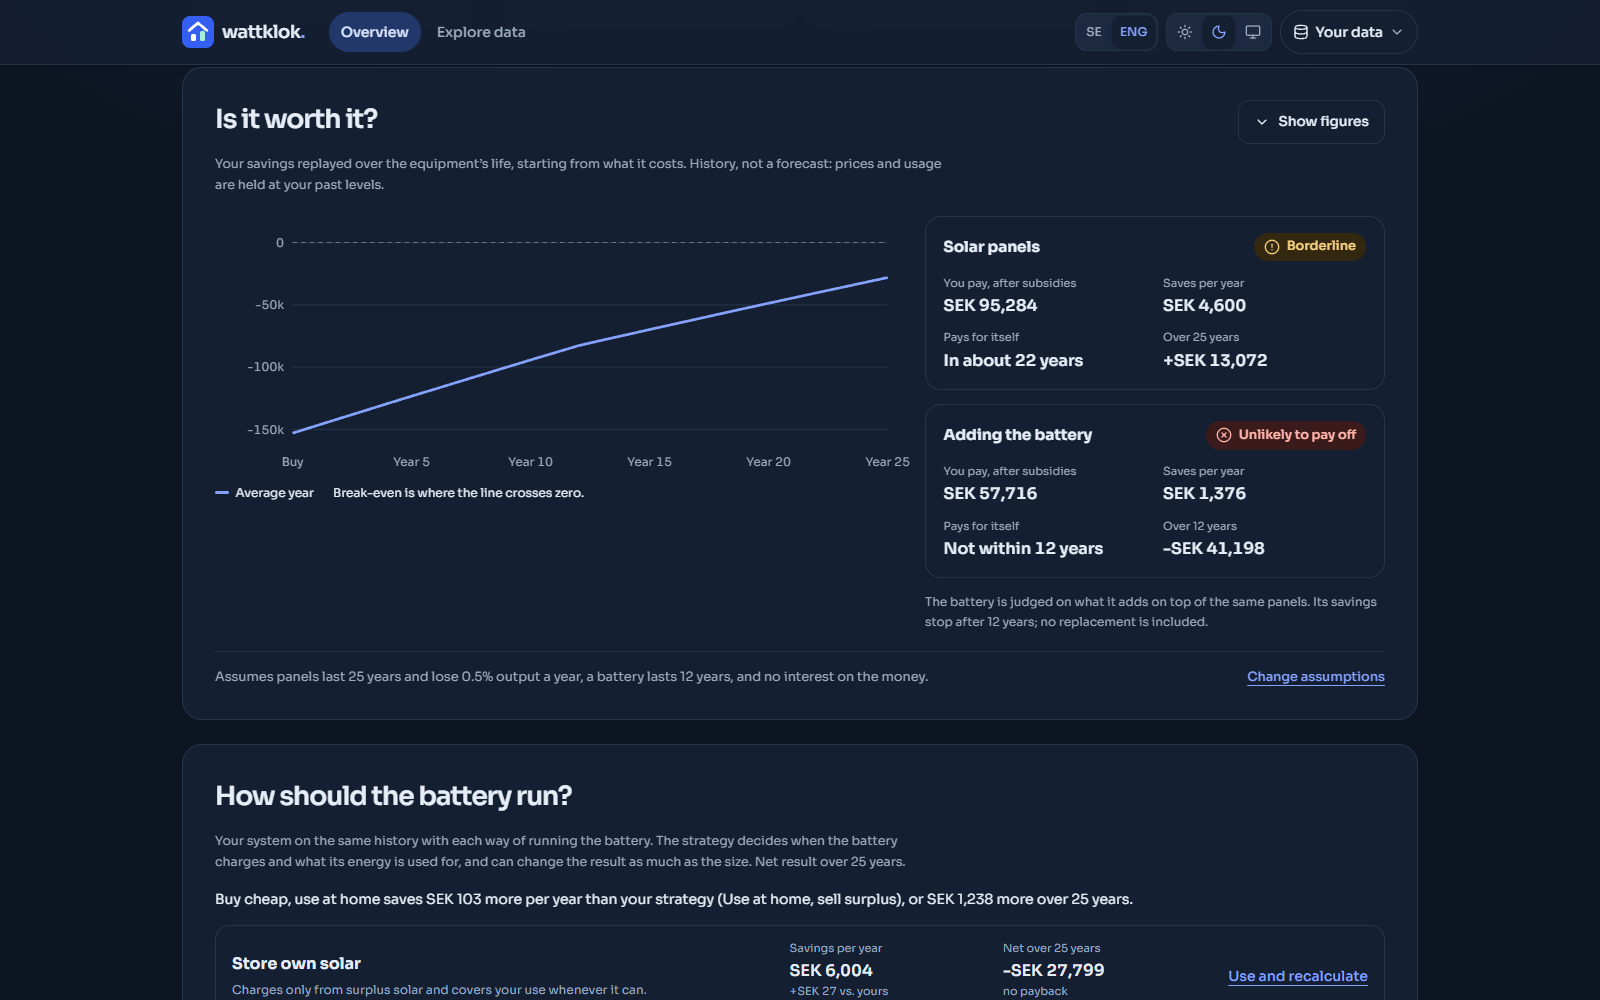
The results are summed into real 12-month windows rather than one averaged "typical year", because the solar and battery models are non-linear. Payback is then replayed over the equipment's life, and the verdict – likely, borderline or unlikely – has to hold in your worst year, not just the average one.
Key features
- An honest answer – payback, yearly savings and a verdict for the panels and the battery separately, so a good solar case can't hide a bad battery.
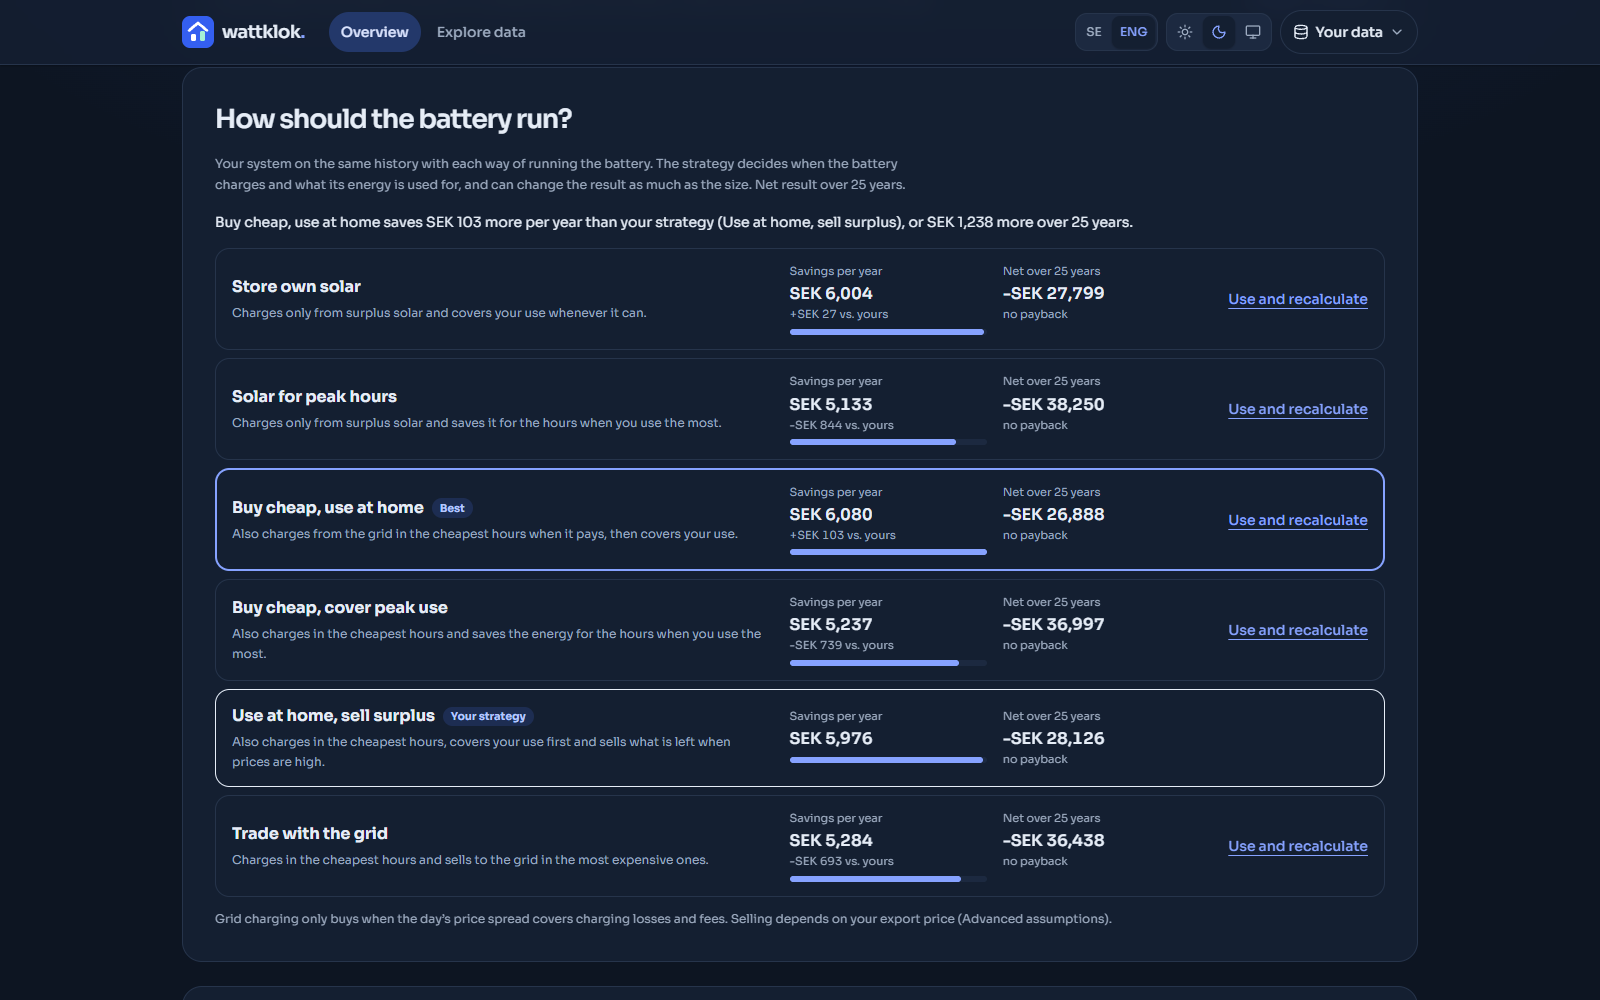
- Battery strategies – from storing your own solar to buying cheap and selling at peaks, each compared on the same history.
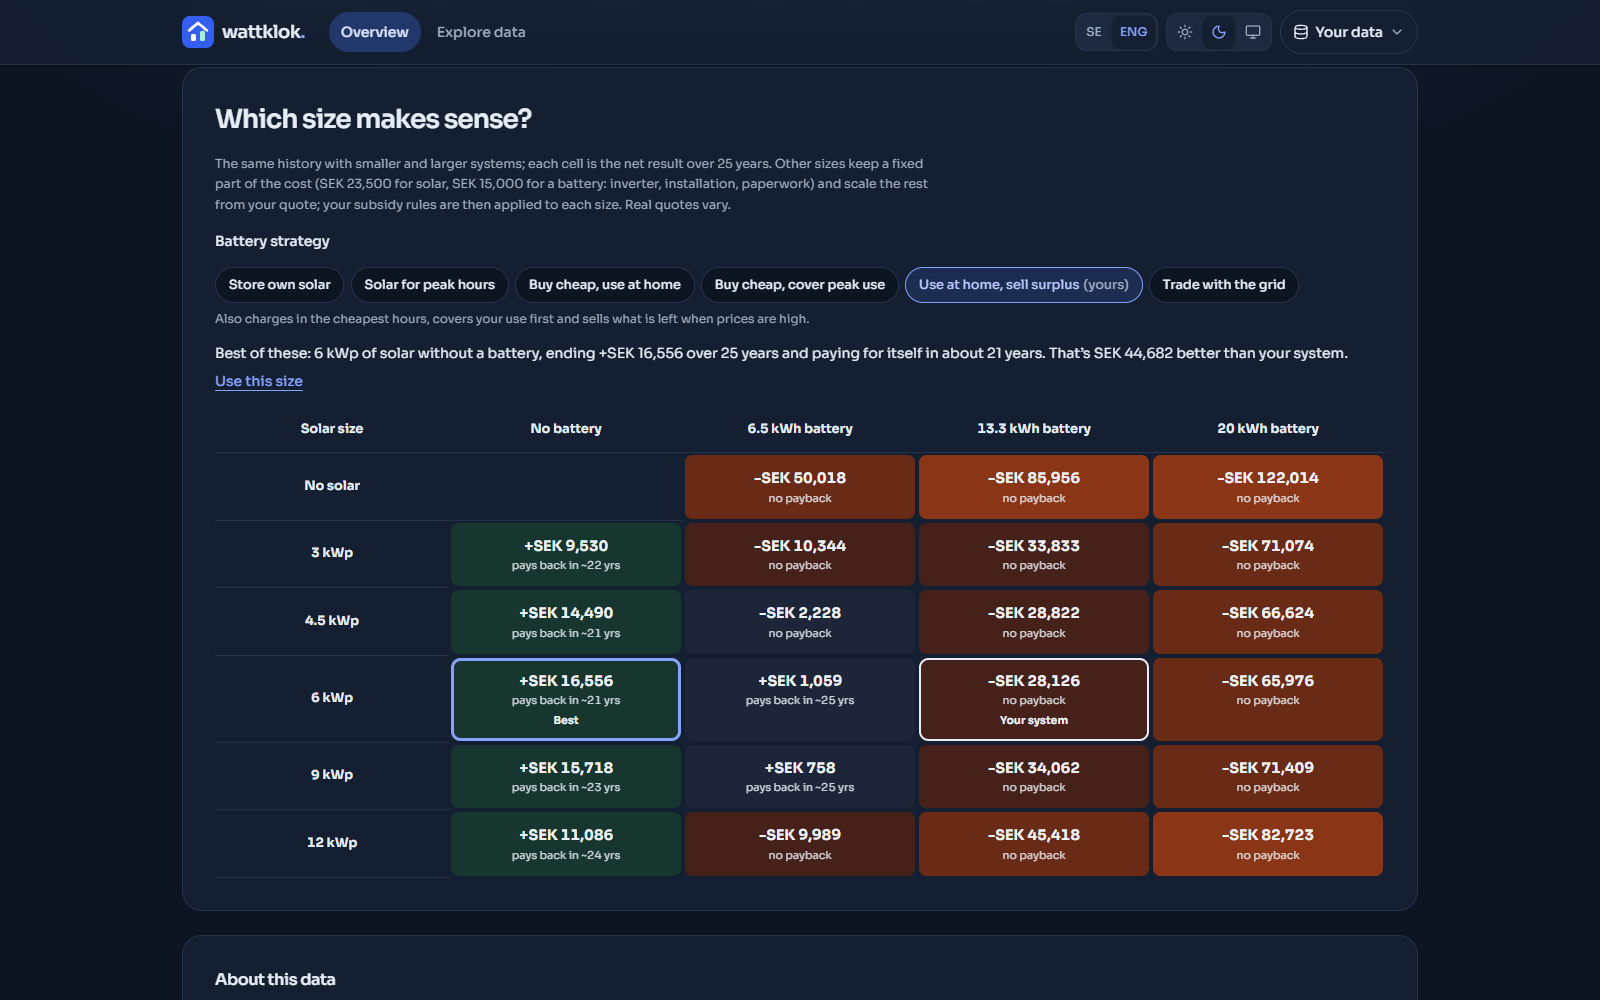
- Size finder – the same history replayed with smaller and larger systems to show where the sweet spot is.
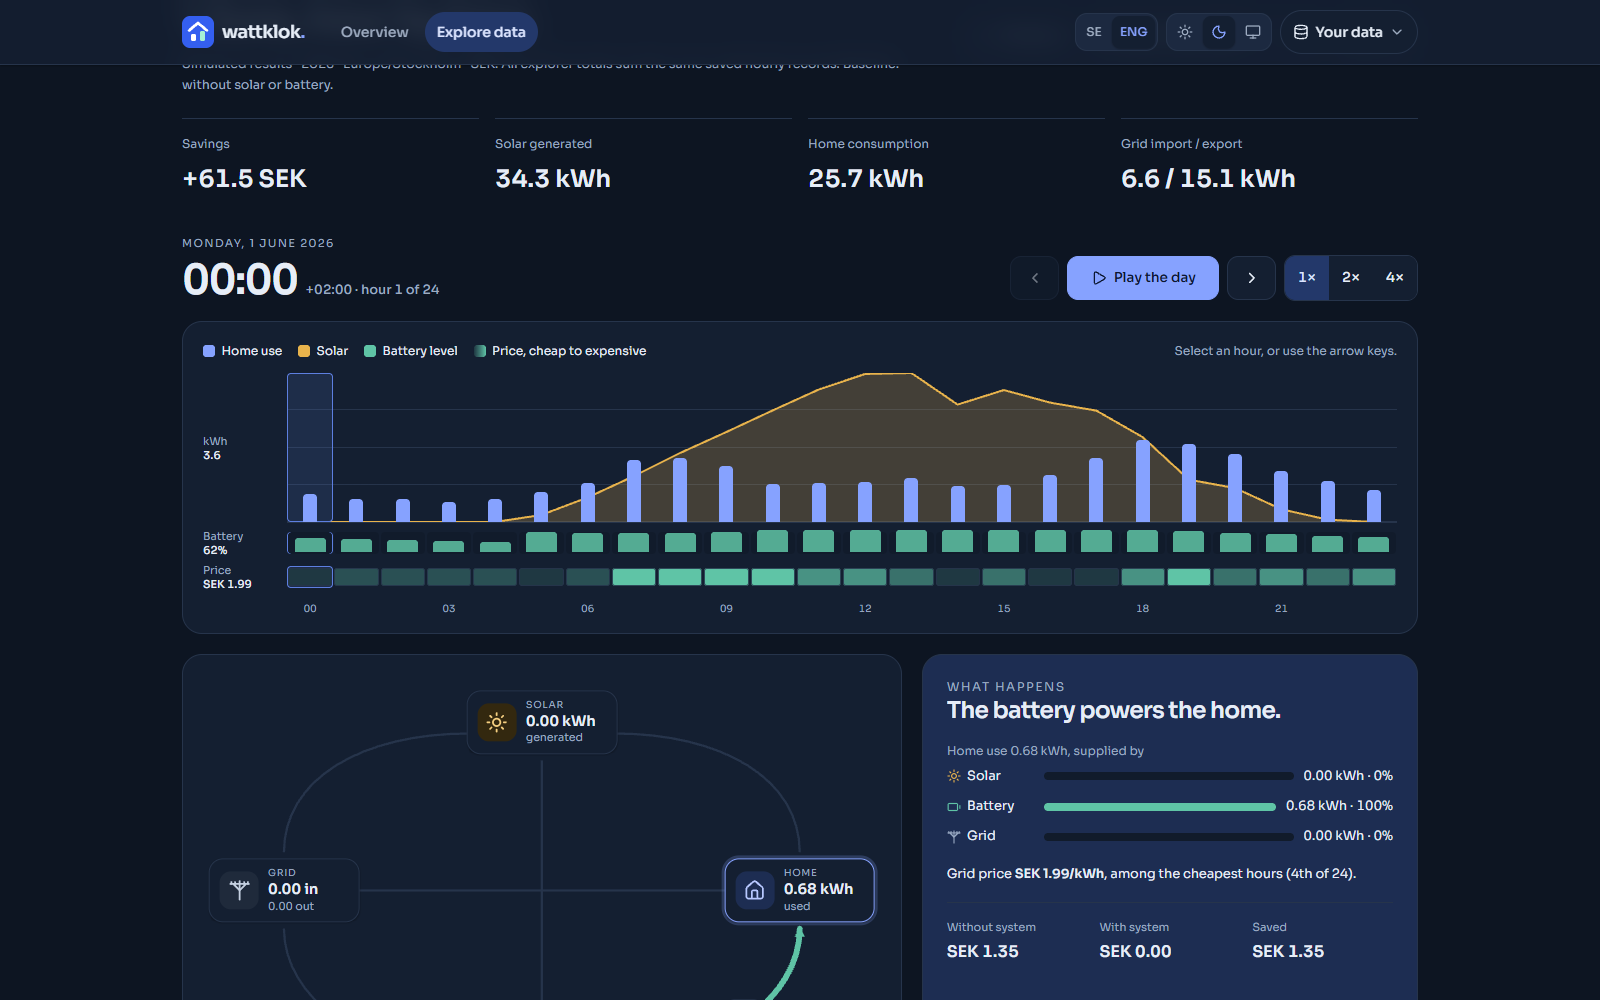
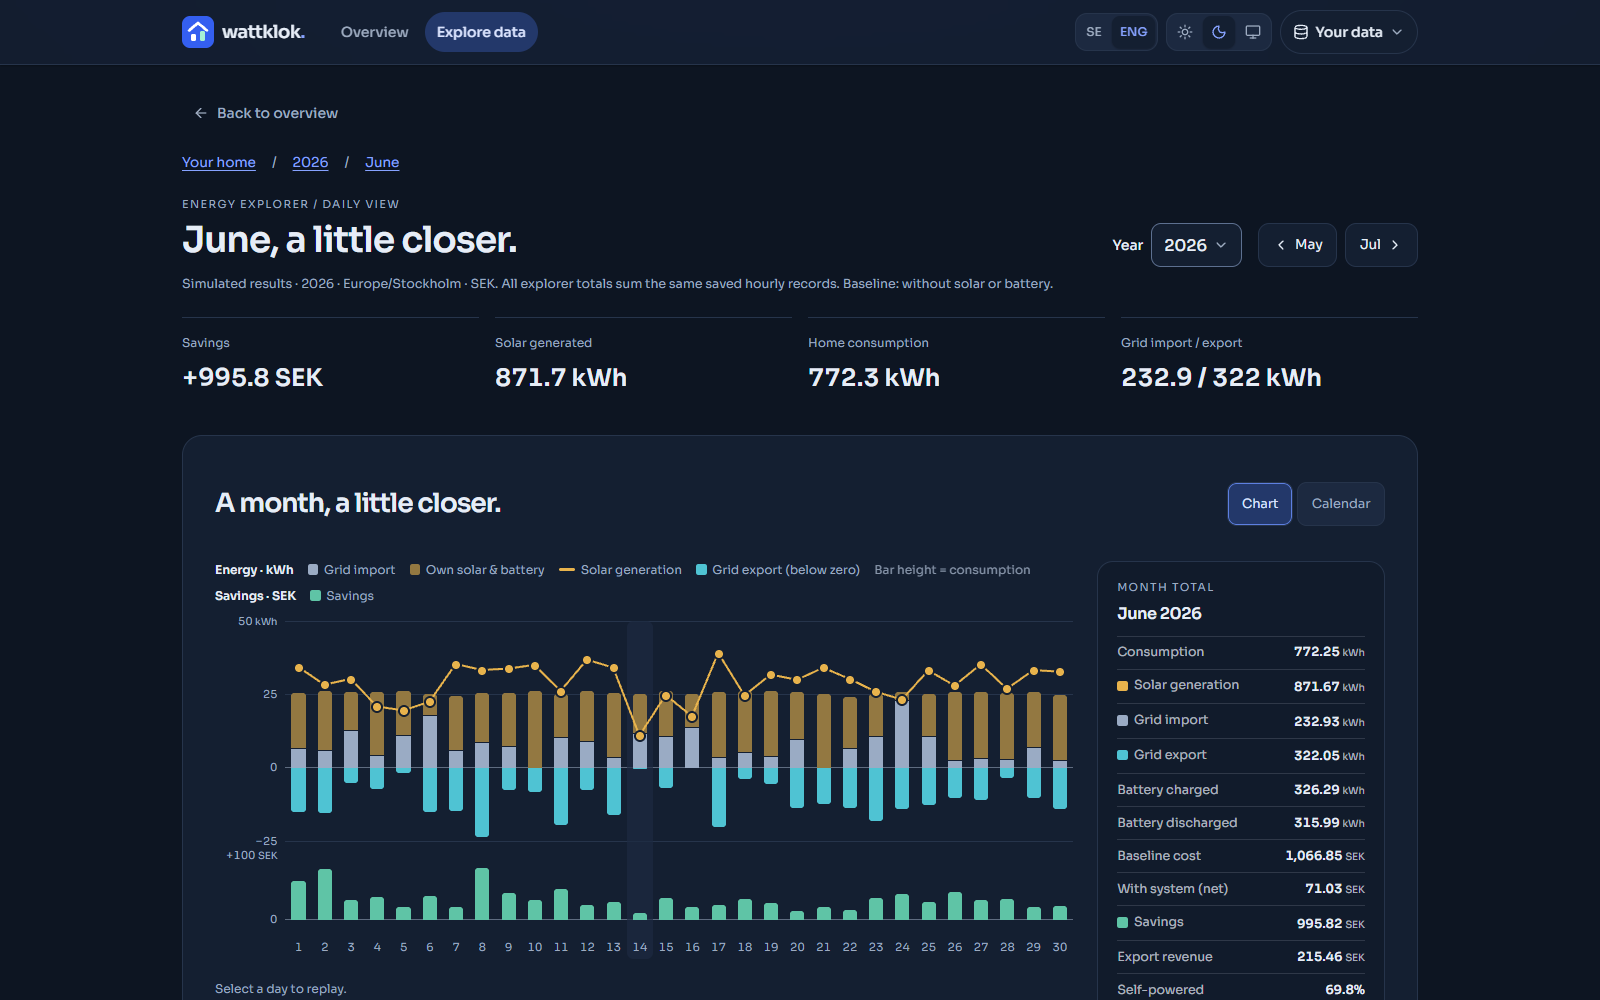
- Explorer – drill from year to month to day, and play back any day hour by hour with an animated energy flow.
- Your data, your way – Tibber, CSV/Excel files from Nordic grid operators, or a generated profile to explore before you have data.
- Swedish and English – with country defaults for Sweden, Norway, Finland and Denmark.
Engineering notes
- Private by construction. There are no accounts and no energy data on the server. The only server routes handle the Tibber login and proxy prices; OAuth tokens stay in HTTP-only cookies, and everything else runs and is stored in the browser.
- Time is the hard part. Consumption, weather and prices only line up if every hour is keyed to the home's local time – including the hour that happens twice when summer time ends.
- Never invent data. Missing hours show as missing, not zero, and imported consumption is treated as grid import, so existing panels are never counted twice.
- Heavy work stays off the main thread. Imports and simulations run in Web Workers, and hourly records are stored as typed-array columns to keep large histories fast to load.
Status
Wattklok has just been redesigned and translated.
Screenshots